


Table of Contents
Overview
-
- What you need to know
- Definition
Executive Summary
-
- Overview
-
- Figure 1: Total US sales and fan chart forecast of c-store foodservice sales, at current prices, 2011-21
- The issues
- Consumers choose c-stores based on convenience and gas prices
-
- Figure 2: Important factors when choosing a c-store, January 2018
- QSRs (quick-service restaurants) outperform c-stores in most metrics
-
- Figure 3: C-stores versus QSRs, January 2018
- C-store food has improved, but still has room for growth
-
- Figure 4: C-store foodservice attitudes, January 2018
- The opportunities
- New concepts can attract a more diverse audience
-
- Figure 5: C-store concept interest, by gender and age, January 2018
- C-store foodservice consumers want more choices/healthy options
-
- Figure 6: C-store visitation motivators, by c-store foodservice consumers, January 2018
- Leverage existing brand loyalty
-
- Figure 7: C-store foodservice brand loyalty, by generation, January 2018
- What it means
The Market – What You Need to Know
-
- C-store sales growing, albeit at a slower rate
- Competitors experience strong growth
- C-stores respond to consumers’ interest in health
Market Size and Forecast
-
- C-stores foodservice sales slow
-
- Figure 8: Total US sales and fan chart forecast of c-store foodservice sales, at current prices, 2012-22
- Figure 9: Total US sales and forecast of convenience store foodservice, at current prices, 2012-22
Market Breakdown
-
- Prepared foods command largest share of the market
-
- Figure 10: Total US sales and forecast of convenience store foodservice, by segment, at current prices, 2012-22
- Figure 11: Total US sales and forecast of convenience store foodservice, by segment, at current prices, 2012-22
-
- Figure 12: Total US sales and forecast of convenience store foodservice, by segment, at current prices, 2015 and 2017
Market Perspective
-
- QSR chains are thriving
- Retailers start targeting c-store occasions
Market Factors
-
- Gas prices rebound only slightly
-
- Figure 13: US gasoline and diesel retail prices, January 2007-December 2017
- The creeping threat of electric cars
-
- Figure 14: Interest in hybrid/electric vehicle ownership/type of hybrid/electric vehicle interest, February 2018
-
- Figure 15: Reasons for buying a hybrid/electric vehicle, February 2018
- Road trips on the rise
-
- Figure 16: Annual vehicle-distance traveled (billion miles), moving 12-month total on all roads, Jan 2007-Nov 2017
- C-stores stock more healthful CPG items
-
- Figure 17: NACS photo: New Hillshire Snacking Products
-
- Figure 18: NACS photo: Powerful Oatmeal
- Figure 19: NACS photo: Organic Valley Good to Go Hard-Boiled Eggs
- CSDs sales are down, can c-stores benefit from this trend?
-
- Figure 20: Arctic Coke and the Pursuit of the Perfectly Slushy Coca-Cola
-
- Figure 21: Total US retail sales and forecast of carbonated soft drinks by segment, at current prices, 2011-21
Key Players – What You Need to Know
-
- C-store food grows/diversifies
- Tech makes c-stores even more convenient
- C-stores fight to compete with QSRs
What’s Working?
-
- General c-store foodservice improvements
- C-stores build branded partnerships
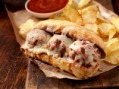
- Breakfast battleground
-
- Figure 22: C-store breakfast sandwich examples
-
- Figure 23: C-store breakfast bowl examples
- C-stores diversify beverage offerings
-
- Figure 24: Change in c-store beverage incidence, Q4 2015 – Q4 2017
What’s Next?
-
- The future of c-stores in a gas-less society
- QSR value wars spill over into c-stores
- C-stores refine convenience through technology
- Can the market support a “premium” c-store?
- Social media trends shape c-store market
- Trending C-store food and beverage flavors
- Food
-
- Figure 25: Menu Matrix, c-store food flavors, top 20 menued flavors, Q4 2015-Q4 2017
- Drinks
-
- Figure 26: Menu Matrix, c-store beverage flavors, top 20 menued flavors (excluding cola), Q4 2015-Q4 2017
The Consumer – What You Need to Know
-
- Most c-store visits are quick fill-ups
- Heavy visitors drive brand loyalty and total sales
- C-stores lose out to QSRs in most cases
- C-store food is getting better, but there is still room for improvement
C-store Visitation
-
- Four out of five consumers visit c-stores
-
- Figure 27: General c-store visitation, January 2018
- iGens represent core c-store customers
-
- Figure 28: General c-store visitation, any c-store, by select demos, January 2018
- Negative perceptions don’t prohibit visitation
-
- Figure 29: Reasons for not visiting a c-store, January 2018
C-store Visitation Frequency
-
- Half of consumers are heavy c-store users
-
- Figure 30: C-store visitation frequency, January 2018
- Heavy c-store visitor demographic profile
-
- Figure 31: Heavy c-store visitor, demographic profile, indexed against all c-store customers, January 2018
C-store Most Important Factors
-
- Convenience and prices determine c-store visitation
-
- Figure 32: Important factors when choosing a c-store, January 2018
-
- Figure 33: Important factors when choosing a c-store, any rank, by c-store visitation frequency, January 2018
Reasons for Visiting C-stores
-
- Food/drink purchases are the second most common c-store occasion
-
- Figure 34: Reasons for visiting c-stores in the past three months, January 2018
-
- Figure 35: C-store food and beverage purchases, among c-store food and drink buyers, January 2018
- C-stores satisfy various needs for heavy visitors
-
- Figure 36: Reasons for visiting c-stores in the past three months, by c-store visitation frequency, January 2018
- Younger women are an important potential consumer group
-
- Figure 37: Reasons for visiting c-stores in the past three months, by gender and age, January 2018
-
- Figure 38: C-store food and beverage purchases, among c-store food and drink buyers, by gender and age, January 2018
C-store Visitation Motivators
-
- Increase visitation with more choices and healthy options
-
- Figure 39: C-store visitation motivators, by c-store foodservice consumers, January 2018
C-store Foodservice Brand Loyalty
-
- Over a third of foodservice consumers are brand loyal
-
- Figure 40: C-store foodservice brand loyalty, January 2018
-
- Figure 41: C-store foodservice brand loyalty, by select demographics, January 2018
- Gasless c-store visitors and heavy visitors are most brand loyal
-
- Figure 42: C-store foodservice brand loyalty, by c-store type visitors, January 2018
-
- Figure 43: C-store foodservice brand loyalty, by c-store visitation frequency, January 2018
Reasons for C-store Loyalty
-
- Convenience not quality drives loyalty
-
- Figure 44: Reasons for c-store brand loyalty, among brand loyalists, January 2018
C-store Concept Interest
-
- Bakery and breakfast items garner highest interest
-
- Figure 45: C-store concept interest, January 2018
- Attract Millennials with new foodservice concepts
-
- Figure 46: C-store concept interest, by generation, January 2018
-
- Figure 47: C-store concept interest, by gender and age, January 2018
- Interactive concepts appeal to brand loyalists
-
- Figure 48: C-store concept interest, by c-store loyalty, January 2018
C-stores versus QSRs
-
- C-stores excel at snacks and drinks, struggle with healthy options and breakfast
-
- Figure 49: C-stores versus QSRs, January 2018
C-store Foodservice Attitudes
-
- C-store perception still struggles despite improvements
-
- Figure 50: C-store foodservice attitudes, any agree, January 2018
- Coffee may help build brand loyalty
-
- Figure 51: C-store foodservice attitudes, any agree, by c-store brand loyalty, January 2018
- Boomers have lowest perception of c-store food
-
- Figure 52: C-store foodservice attitudes, any agree, by generation, January 2018
- C-store attitudes relate to location
-
- Figure 53: C-store foodservice attitudes, any agree, by census region, January 2018
-
- Figure 54: C-store foodservice attitudes, any agree, by area, January 2018
- Southern cities may be an area for new store development
-
- Figure 55: Key drivers of agreeing that more c-stores should offer MTO foods, key driver output, January 2018
- Improvements can appeal to younger women
-
- Figure 56: C-store foodservice attitudes, any agree, by gender and age, January 2018
Appendix – Data Sources and Abbreviations
-
- Data sources
- Sales data
- Fan chart forecast
- Consumer survey data
- Mintel Menu Insights
- Abbreviations and terms
- Abbreviations
- Terms
Appendix – The Market
-
-
- Figure 57: Total US sales and forecast of convenience store foodservice, by segment, at current prices, 2015 and 2017
- Figure 58: Total US sales and forecast of convenience store prepared food*, at inflation-adjusted prices, 2012-22
-
- Figure 59: Total US sales and forecast of convenience store hot dispensed beverages, at inflation-adjusted prices, 2012-22
- Figure 60: Total US retail sales and forecast of convenience store cold dispensed beverages, at inflation-adjusted prices, 2012-22
- Figure 61: Total US retail sales and forecast of convenience store frozen dispensed beverages, at inflation-adjusted prices, 2012-22
-
Appendix – The Consumer
-
- TURF analysis methodology
-
- Figure 62: TURF analysis – C-store concept interest, January 2018
Appendix – Key Driver Analysis
-
- Interpretation of results
-
- Figure 63: Key drivers of agreeing that eating at the store is enjoyable, key driver output, January 2018
-
- Figure 64: Key drivers of agreeing eating at the store is enjoyable – Key driver output, January 2018
- Interpretation of results
-
- Figure 65: Key drivers of agreeing more should offer made-to-order foods – Key driver output, January 2018
Back to top


