


Table of Contents
Executive Summary
-
- The market
- Cautious outlook as housing transactions slow
-
- Figure 1: Consumer spending on bathroom fittings and furniture, 2012-22
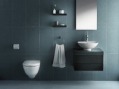
- Practical storage plus attractive styling boosts bathroom accessories
- Showers and cabinet furniture popular in today’s bathrooms
-
- Figure 2: Market for bathroom fittings and accessories, by segment, 2017 (est)
- Stamp duty changes disturb the housing market
- Companies, brands and innovation
- Concentration of the market
-
- Figure 3: Distribution of bathrooms, by retailer, 2017 (est)
- Key suppliers and their brands
- High growth for bathroom specialists
- Pureplay online sellers growing rapidly
- Attracting small builders
- Alternatives to out-of-town sites
- Better visuals for bathroom designs
- Growth of the smart home
- The consumer
- Just one bathroom in 67% of homes
- 44% of households repaired or updated bathrooms in the last 3 years
- 58% of owner-occupiers appointed their own bathroom fitter
- B&Q is, by some distance, the most-used retailer for bathrooms
-
- Figure 4: Retailers used for most recent bathroom project, June 2017
- Service influences shoppers
-
- Figure 5: Factors influencing choice of retailer, June 2017
- Broad spread of interest in advanced bathroom innovation
-
- Figure 6: Interest in innovative bathroom products, June 2017
- What we think
Issues and Insights
-
- Are shoppers flocking to online sellers?
- The facts
- The implications
- What are the key factors influencing choice of retailer?
- The facts
- The implications
- What is the impact of the rise in private renting on demand for bathrooms?
- The facts
- The implications
The Market – What You Need to Know
-
- Cautious consumers defer spending
- Slow growth between 2017-22
- Showers and cabinet furniture popular in today’s bathrooms
- Rise of the multiple groups
- Rise of online bathroom specialists
- Changes among DIY retailers
- Two thirds of adults prefer to shower
- Efficient use of water
- The age of the smart meter
- More multi-generation households
- Stamp duty changes disturb the housing market
Market Size and Forecast
-
- Cautious consumers defer spending
-
- Figure 7: Consumer spending on bathroom fittings and furniture, 2012-22
- Figure 8: Consumer spending on bathroom fittings and furniture, 2012-22
-
- Figure 9: Consumer spending on bathroom accessories, 2012-22
- Forecast methodology
Market Segmentation
-
- Showers and cabinet furniture popular in today’s bathrooms
-
- Figure 10: Market for bathroom fittings and accessories, by segment, 2017 (est)
- Strong demand for showers
-
- Figure 11: Bathroom fittings market, by segment, 2012-17 (est)
- Fitting furniture in the bathroom
- Innovation in the shower market
- Shower heads are a style highlight in the bathroom
- Statement features encourage consumers to spend more
- Innovation in WCs
- Larger mirrors
- Advances in lighting and controls
Channels to Market
-
- Concentration of the market
-
- Figure 12: Distribution of bathrooms, by retailer, 2017 (est)
- Rise of online bathroom specialists
- Changes to the DIY market
Market Drivers
-
- 13% of adults shower more frequently
-
- Figure 13: Changes to bathroom routines, November 2016
- Efficient use of water
- The age of the smart meter
- More multi-generation households
-
- Figure 14: Living with parents, by age, 2000-16
- Stamp duty changes disturb the housing market
-
- Figure 15: Housing transactions, December 2015-May 2017
- How consumers feel about their finances
-
- Figure 16: Trends in how respondents would describe their financial situation, January 2015-June 2017
Companies, Brands and Innovation – What You Need to Know
-
- Key suppliers and their brands
- High growth for bathroom specialists
- Pureplay online sellers growing rapidly
- Attracting small builders
- Alternatives to out-of-town sites
- Different approaches to branding
- Jostling for price leadership
- Bathrooms could be monitoring health
- Smarter bathrooms could aid the beauty market
- Growth of the smart home
- Better visuals for bathroom designs
Companies and Brands – Suppliers
-
- Key suppliers and their brands
-
- Figure 17: Leading companies in the bathroom furniture and accessories market and their brands, 2017
- Key supplier revenues
-
- Figure 18: Selected leading bathroom suppliers, revenue MSP, 201216
- Key supplier operating profits
-
- Figure 19: Selected leading bathroom suppliers, operating profit, 2012-16
Companies and Brands – Retailers
-
- High growth for bathroom specialists
- Pureplay online sellers growing rapidly
- Big changes in the DIY sector
-
- Figure 20: Selected bathroom retailers, turnover, 2012-16
- Attracting small builders
- Bathstore is the only major specialist
- Other bathroom specialists
- Wren no longer selling bathrooms
- IKEA serving a niche market
- Non-specialists in the bathroom market
Competitive Strategies
-
- Alternatives to out-of-town sites
- Matalan adds bathrooms online
- Focus on full service
- B&Q goes an extra mile to assure people about its fitters
- Different approaches to branding
- Over-reliance on discounting
- Loyalty cards
- Encouraging trade custom
Launch Activity and Innovation
-
- Your bathroom could be monitoring your health
- Smarter bathrooms could aid the beauty market
-
- Figure 21: Google ideas does a smart bathroom, 2016
- Growth of the smart home
- Safer shower trays address an ageing demographic
-
- Figure 22: Anti-slip shower tray from Kohler Mira, 2017
- Grohe’s Red Dot awards recognise exceptional design
-
- Figure 23: Grohe Sensia Arena shower toilet, 2017
- Bathstore launches augmented reality service
- Creating better toilets for third-world communities
Advertising and Marketing Activity
-
- Static advertising spend over three years
-
- Figure 24: Total above-the line, online display and direct mail advertising expenditure on bathrooms, 2013-16
- Bathstore is the largest advertiser of bathrooms
-
- Figure 25: Total above-the line, online display and direct mail advertising expenditure on bathrooms, by advertiser, 2013-16
- Television accounts for over half of adspend
-
- Figure 26: Above-the line, online display and direct mail advertising expenditure on bathrooms, by media, 2016
- Advertising specifics
-
- Figure 27: Bathstore, Advertising image, 2016
- Figure 28: Victoria Plum, Advertising image, 2016
-
- Figure 29: Victorian Plumbing, Flying Van, September 2016
- Nielsen Ad Intel coverage
The Consumer – What You Need to Know
-
- Just one bathroom in 67% of homes
- 44% of households repaired or updated bathrooms in the last 3 years
- 58% of owner-occupiers appointed their own bathroom fitter
- B&Q is, by some distance, the most-used retailer for bathrooms
- Service influences shoppers
- Broad spread of interest in advanced bathroom innovation
Bathrooms in the UK’s Homes
-
- Two thirds of UK homes have just one bathroom
-
- Figure 30: Number of bathrooms in household, June 2017
- 29% of homes have a separate toilet/cloakroom
-
- Figure 31: Separate toilet/cloakroom in household, June 2017
- Owner-occupiers are more likely to own a separate toilet
Bathroom Installations and Repairs
-
- 44% of households repaired or updated bathrooms in the last 3 years
-
- Figure 32: Bathroom installations and repairs in the last three years, June 2017
Who Fitted the Bathroom?
-
- 58% of owner-occupiers appointed their own bathroom fitter
- People choose fitters on trust
- Retailers must cater to the needs of builders
- 23% of bathrooms are DIY projects
-
- Figure 33: Who fitted the bathroom?, June 2017
Spend on Most Recent Bathroom Project
-
- People spend around £1,000 on fittings
-
- Figure 34: Spend on most recent bathroom project, June 2017
Retailers Used for Last Bathroom Project
-
- B&Q is the most-used retailer
- IKEA popular with private renters
- Scope for expansion for Bathstore
-
- Figure 35: Retailers used for most recent bathroom project, June 2017
Factors Influencing Choice of Retailer
-
- Simple to compare prices
- The importance of trust
- Will bathroom retailers lose share to the internet?
- Showrooms remain relevant
- Technology can help visualise
- Spreading the cost
-
- Figure 36: Factors influencing choice of retailer, June 2017
Interest in Innovative Bathroom Products
-
- 42% want a self-cleaning toilet
- A clear view in the mirror
- Emerging interest in smart bathrooms
-
- Figure 37: Interest in innovative bathroom products, June 2017
Appendix – Data Sources, Abbreviations and Supporting Information
-
- Abbreviations
- Consumer research methodology
Appendix – Market Size and Forecast
-
- Forecast methodology
Back to top


